| Completed | Models | Points | Hours | Crisis | |
|---|---|---|---|---|---|
| Totals | 30 | 376 | 10697 | 725 | 103 |
| Averages | 86% | 11.1 | 314.6 | 21.3 | 2.9 |
The first month shows a solid level of engagement with 30 completed entries producing a total of 376 models and 10697 points across 725 hours of work. On average this translates to just over 11 models and 314 points per participant, with around 21 hours invested and a crisis level sitting just below 3. The completion rate of 86 percent indicates that most participants are actively contributing, while the balance between output and time suggests a mix of steady production and more time intensive approaches. Overall the numbers point to a strong and consistent start with enough variation in effort and output to create meaningful separation as the challenge progresses.
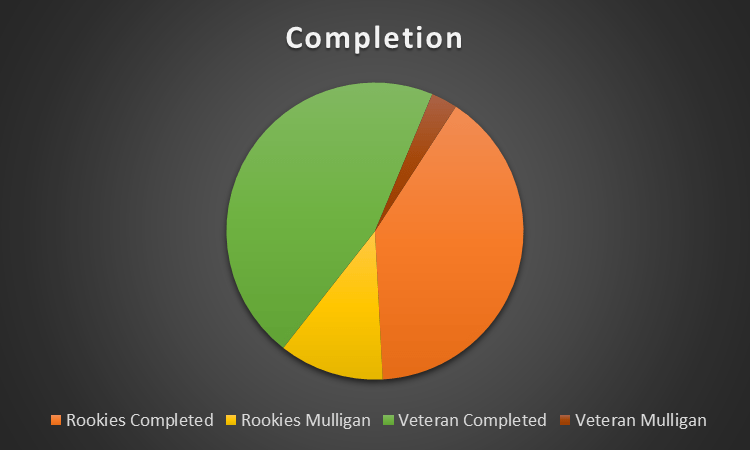
Completion is dominated by successful outcomes across both groups, with veterans making up the largest share of completed entries, followed by a strong contribution from rookies. Mulligans remain a smaller portion overall, with rookies accounting for most of them while veteran mulligans are almost negligible. This suggests that experience is translating into consistency, while newer participants are still finding their footing.
| Part of World | Hours per Model | Model Total | Avg Crisis | Avg Bingo Points | Avg Hours |
|---|---|---|---|---|---|
| America | 2.5 | 103 | 2.7 | 33.0 | 19.6 |
| Europe | 3.1 | 189 | 3.0 | 26.8 | 22.9 |
| Oceania | 4.7 | 84 | 3.1 | 25.6 | 20.3 |
Europe is carrying the largest share of the output with 189 models, clearly ahead of America on 103 and Oceania on 84, but this comes with a higher time investment at 3.1 hours per model compared to America’s much faster 2.5. Oceania stands out as the most time intensive region at 4.7 hours per model, indicating a slower and more deliberate approach despite lower overall volume. Crisis levels are relatively consistent across regions, though slightly higher in Europe and Oceania, while America maintains the lowest at 2.7 alongside the highest bingo score of 33.
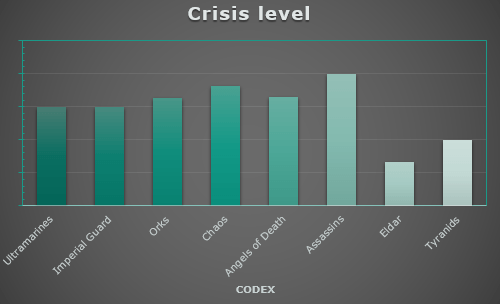
Crisis levels vary noticeably by codex, with Assassins standing out at the top as the most unstable group, followed by Chaos and Orks sitting consistently above the midpoint. Ultramarines and Imperial Guard land in a more controlled middle range, while Angels of Death remain slightly elevated but not extreme. At the opposite end, Eldar show the lowest crisis levels by a clear margin, with Tyranids also relatively stable. This is surprising!
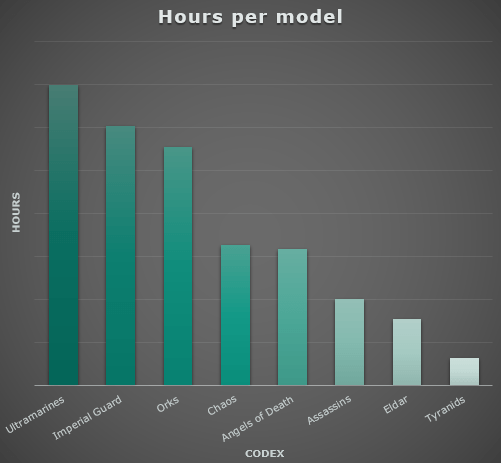
There is a clear spread in time investment per model across codexes, with Ultramarines and Imperial Guard sitting at the top, indicating a slow and deliberate approach where each model receives significant attention. Orks follow in a similar but slightly less extreme range, still leaning toward time intensive work. Chaos and Angels of Death occupy the middle ground with a more balanced pace, suggesting a mix of efficiency and detail. At the opposite end, Assassins, Eldar, and especially Tyranids show very low hours per model, pointing toward fast execution and a strong emphasis on throughput over individual model investment. Again, quite surprising to see Eldar at this end of the spectrum. It is probably heavily driven by TJM.
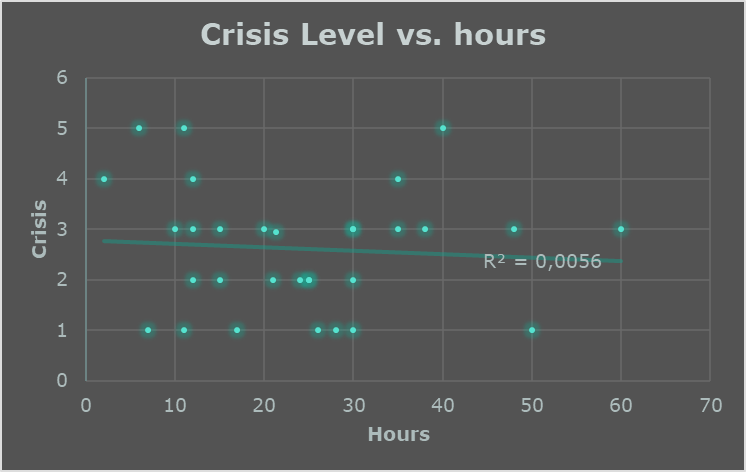
There is essentially no relationship between time invested and crisis level, with the trend line being almost completely flat and an R² of 0.0056 confirming that hours explain virtually none of the variation. Painters logging very high hours are just as likely to experience low crisis levels as those putting in minimal time, while several of the highest crisis scores appear in the mid to low hour range. This suggests that crises are not driven by workload but rather by individual approach, planning, or randomness, making crisis a behavioural metric rather than a consequence of effort.
The Resilience Performance Index (Bullshit, maybe, but also maybe not)
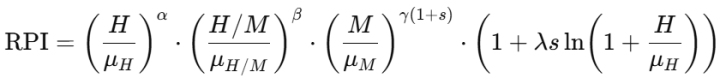
The Resilience Performance Index combines workload, output and craft depth into a single measure that rewards balance rather than specialization. It compares each painter to the field average across all three dimensions and then applies a scaling factor that favours sustained effort without letting extreme hours dominate completely. The result is that painters who perform well across the board rise sharply, while those relying on a single strength are heavily penalised. This creates a clear separation between complete all round performers and more one dimensional approaches, with the highest scores reflecting consistency across every aspect of the challenge rather than dominance in any single metric.
The RPI is built from three core components that reflect different ways of engaging with the challenge, combined into a single measure that rewards balance rather than extremes.
The first term captures workload by comparing hours invested to the field average. This is where painters like Mark Rayner and Jon immediately stand out, putting in significantly more time than most and building a strong foundation for a high overall score.
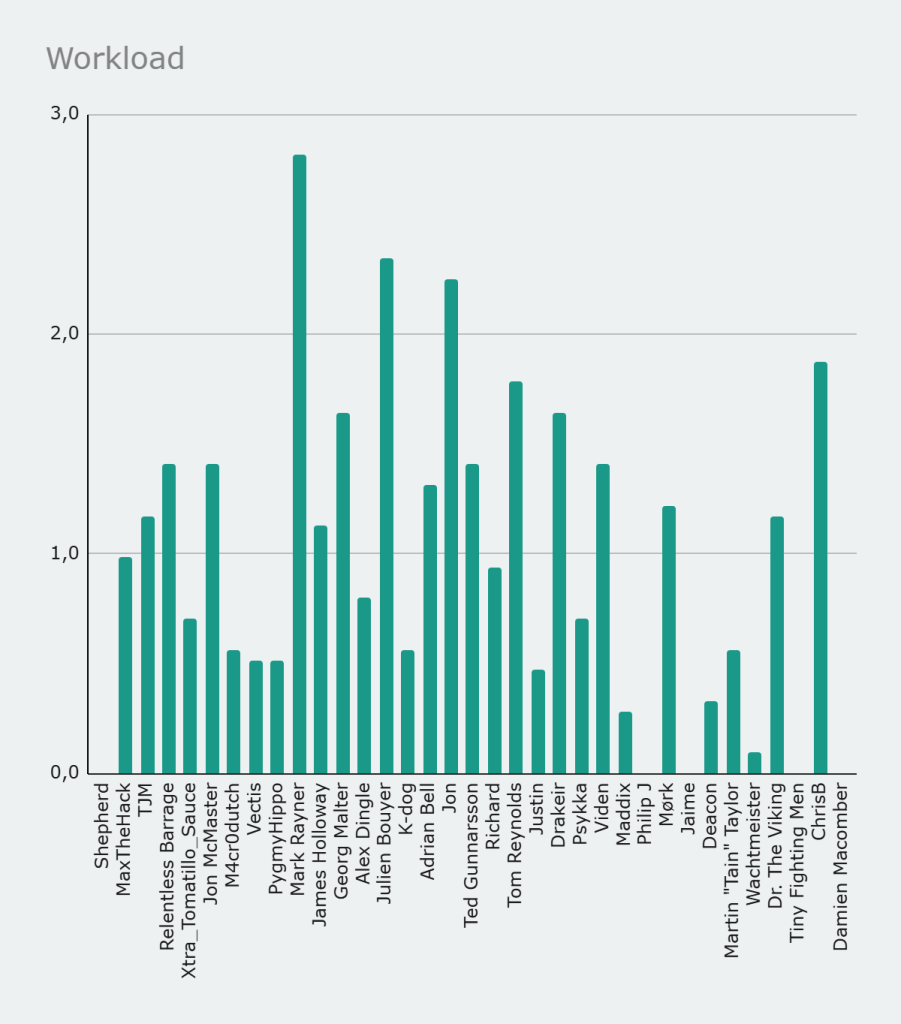
The second term measures craft depth through hours per model. This rewards slower and more deliberate painting, where time is concentrated into fewer models. Painters who lean into detail and refinement gain an advantage here, while high speed batch approaches are naturally penalised.
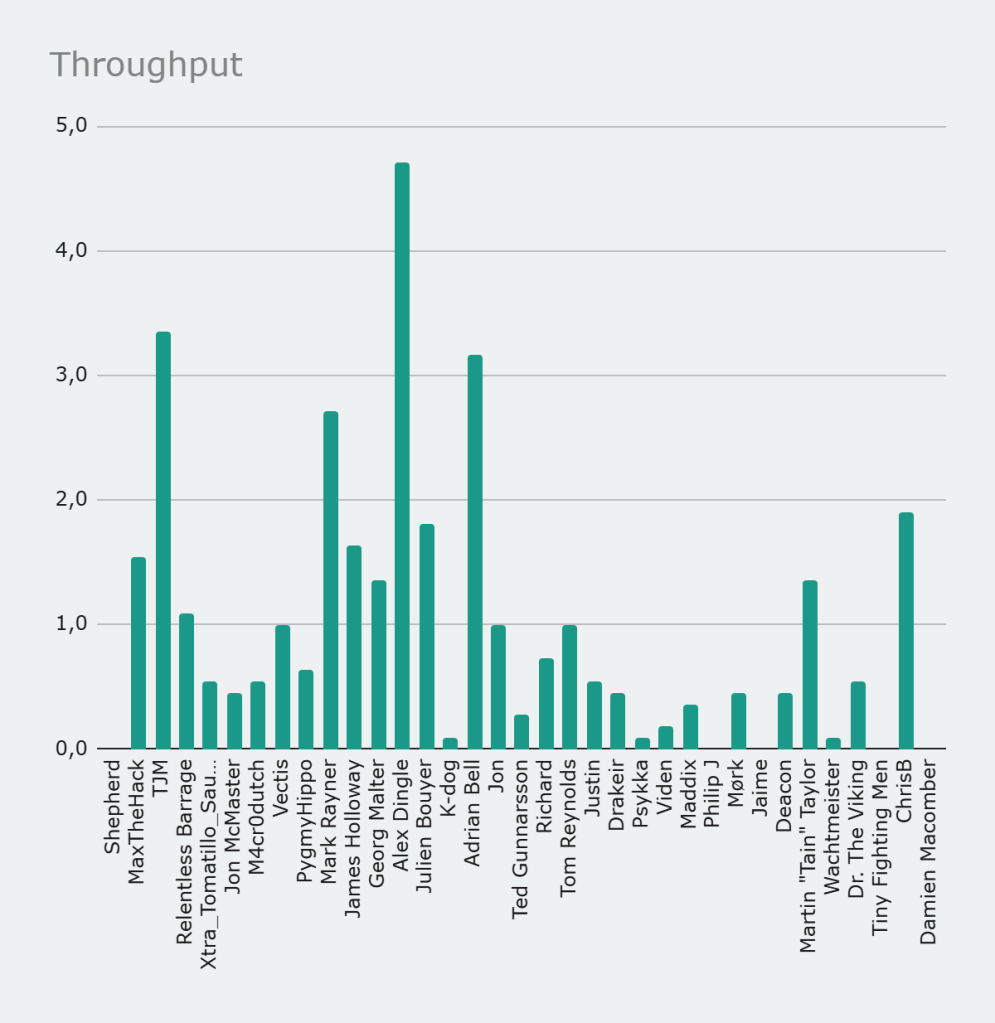
The third term reflects output by comparing model count to the average. This is where painters like Alex Dingle gain ground, pushing large numbers of models through and generating raw progress even if their time per model is low.
These three dimensions are then combined multiplicatively and scaled by a final factor that grows with total hours, giving additional weight to sustained effort without letting it dominate completely. The result is an index that strongly rewards painters who are consistently active, productive and deliberate at the same time.
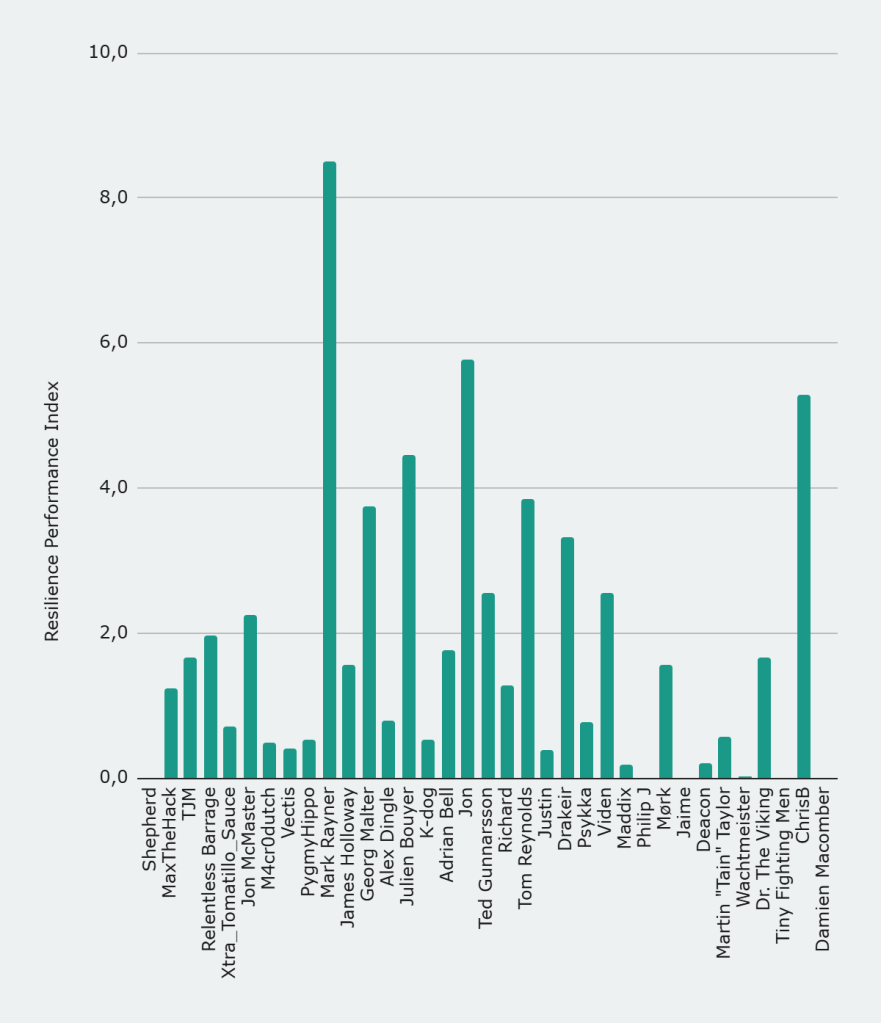
This is why the final distribution looks the way it does. Mark Rayner rises far above the field because he scores strongly across all three components, combining high hours with meaningful output and enough depth to avoid penalties. Jon and ChrisB follow as strong all rounders who perform well across the board but do not reach the same extreme. Julien Bouyer and Tom Reynolds also score highly by maintaining balance rather than relying on a single strength.
In contrast, more specialised profiles are pushed down the ranking. Alex Dingle, despite very high output, is penalised for low time per model. Psykka and others with very high depth but low volume are similarly limited by the output term. At the lower end, painters such as Maddix, Deacon and Philip J fall close to zero because one or more dimensions are almost entirely absent.
Overall, the RPI does not reward who paints the most or who paints the slowest, but who manages to combine effort, output and depth into a coherent and sustained performance across the month.
